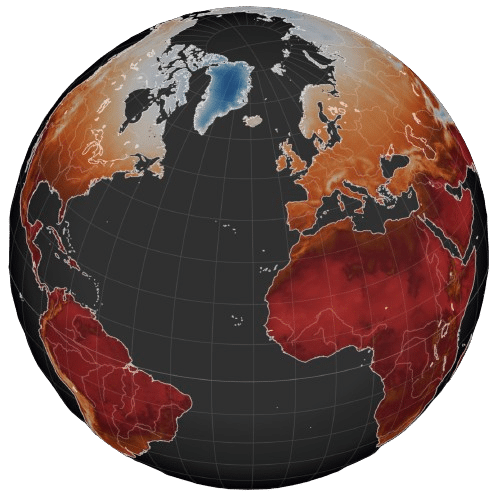
Future cold and frost waves hazard
Overview
A global dataset at 0.1° degrees resolution of six cold and frost waves hazards indicators from five climate models under three Shared Socioeconomic Pathways (SSPs) scenarios from the Intergovernmental Panel on Climate Change (IPCC) Sith Assessment report (AR6). The time resolution is annual from 1981 to 2100.
Cold and frost waves dataset specifications
| Specification | Description |
| Experiment | CMIP6 |
| Scenarios | Shared Socioeconomic Pathways SSP5-8.5, SSP2-4.5 and SSP1-2.6. |
| Climate Models | The 5 models selected by the ISIMIP initiative: IPSL-CM6A-LR GFDL-ESM4, UKESM1-0-LL MPI-ESM1-2-HR, MRI-ESM2-0. |
| Spatial Resolution | 0.1° x 0.1° Global |
| Temporal resolution | Annual from 1981 to 2100 |
| Indicators | The indicators are based on daily maximum and minimum surface temperature: – Cold wave duration index: Annual count of days with at least 3 consecutive days when daily minimum temperature is below the 10th percentile threshold, based on a reference period. – Cold wave duration periods: Annual count of cold wave events defined as periods of at least 3 consecutive days with daily minimum temperature below the 10th percentile threshold. – Consecutive frost days index: Maximum number of consecutive days in a year with minimum temperature below 0°C. – Consecutive frost days periods: Annual count of periods with at least 2 consecutive days with minimum temperature below 0°C. – Very cold days: Annual number of days with maximum temperature below the 10th percentile of the reference period. – Cold nights: Annual number of days with minimum temperature below the 10th percentile of the reference period |
| Format | Netcdf, other formats possible depending on data volume |
Supplementary information
The dataset provides climate indicators that quantify the frequency, intensity, and duration of extreme cold events—such as cold waves and frost periods—under historical and future climate scenarios. Derived from daily surface temperature data, each metric is calculated using scientifically defined thresholds, including absolute values (e.g., below 0°C) and percentiles (e.g., below the 10th percentile), and is based on downscaled simulations from CMIP6 global climate models, enabling analysis across multiple spatial and temporal scales.
Future cold and frost waves dataset availability
The dataset can be delivered according to your specifications, contact us for a quote.

