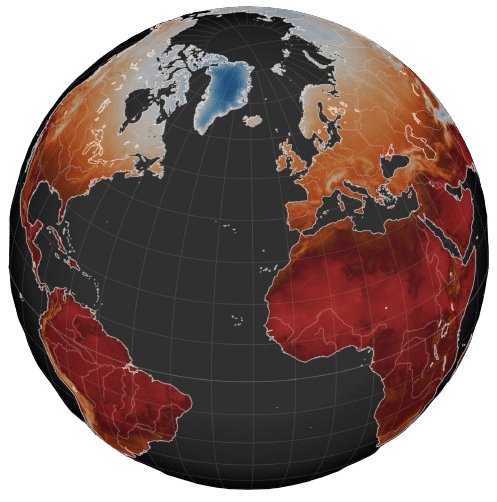
Future Permafrost Thawing Hazard
Overview
A global dataset at 0.1° degrees resolution of permafrost thawing indicator from five climate models under three Shared Socioeconomic Pathways (SSPs) scenarios from the Intergovernmental Panel on Climate Change (IPCC) Sixth Assessment report (AR6). The time resolution is annual from 1981 to 2100.
Permafrost thawing dataset specifications
| Specification | Description |
| Experiment | CMIP6 |
| Scenarios | Shared Socioeconomic Pathways SSP5-8.5, SSP2-4.5 and SSP1-2.6. |
| Climate Models | The 5 models selected by the ISIMIP initiative: IPSL-CM6A-LR GFDL-ESM4, UKESM1-0-LL MPI-ESM1-2-HR, MRI-ESM2-0. |
| Spatial Resolution | 0.1° x 0.1° Global |
| Temporal resolution | Annual from 1981 to 2100 |
| Indicators | The freezing and thawing hazard indicator is based on daily mean air temperatures and quantifies the relative dominance of freezing versus thawing conditions over the course of a year: – Freezing and Thawing Index Ratio: Annual ratio of cumulative freezing degree-days to the sum of freezing and thawing degree-days. Values range from 0 to 1, with higher/lower values indicating dominance of freezing/thawing conditions. |
| Format | Netcdf, other formats possible depending on data volume |
Supplementary information
The Future Permafrost Hazard dataset includes the Freezing and Thawing Index Ratio, a thermal climate indicator that quantifies the balance between cumulative freezing and thawing conditions over the year. Derived from daily air temperatures, the indicator is a robust, dimensionless proxy for assessing permafrost presence and stability. With values ranging from 0 to 1, it enables large-scale permafrost assessments under historical and future climate scenarios, especially in data-scarce regions where ground observations are limited.
For more details on the methodology check this reference:
Smith, S. L., Chadburn, S. E., Burke, E. J., Peng, S., & Lawrence, D. M. (2023). Evaluating permafrost definitions for global permafrost area estimates in CMIP6 climate models. Environmental Research Letters, 18(12), 124013. https://doi.org/10.1088/1748-9326/ad10d7
Permafrost Thawing dataset availability
The dataset can be delivered according to your specifications, contact us for a quote.

